By using WebSphere Application Server Performance Monitoring Infrastructure (PMI) we can monitor the performance of our WebSphere Commerce system. The WebSphere Commerce application server gathers statistics for URLs, tasks, and views. Each data key has an associated set of counters that provide information. For example, the average response time of a task, maximum and minimum response times, and the total number of times a task was called.
Steps to enable WCS Performance module
Step 1
Enable WCS Performance module.
Edit WCDE_ENT70\workspace\WC\xml\config\wc-server.xml and ensure enabled="true" for following entry
<component compClassName="com.ibm.commerce.performance.monitor.PerfMonitor" enable="true" name="PerfMonitor"/>
Step 2
Restart server
Open WAS console :

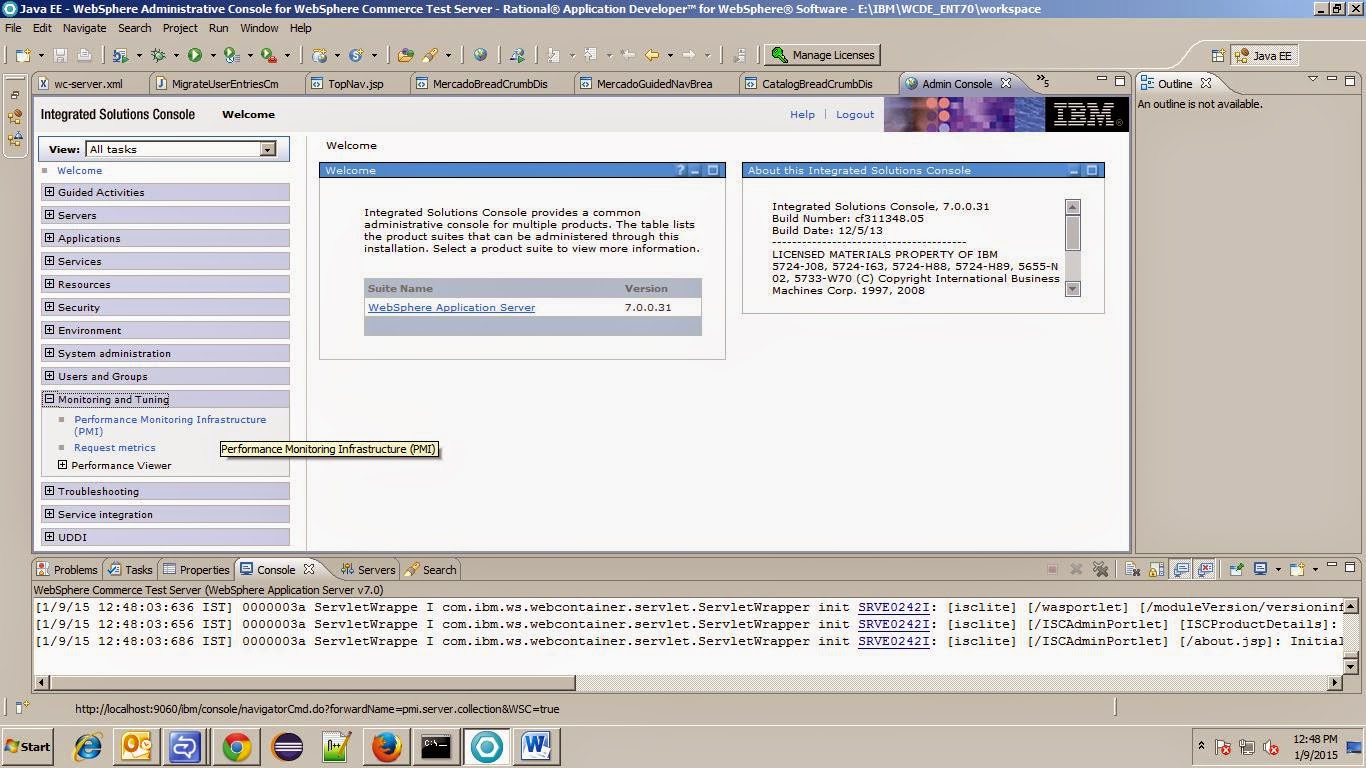
Select Server1 Under this check -
1.Select the Enable Performance Monitoring Infrastructure (PMI) check box.
2.Save and apply the change.


Now under monitoring and tuning - under performance viewer --> In current activity --> Select server1 and click on start monitoring.
By default Performance module for commerce is disabled, as shown in the screenshot below.

Follow this step to enable the module, select options as shown by the markers in the screen shot below.

After selecting the custom option, now make selections as indicated by markers on the screenshot.

Now run the Tivoli performance viewer and collect statistics real time.

After some time you should be able to see the performance stats being plotted real time on the graph.


Using same steps we can enable other stats aswell.
Refrence :WCS PMI Module, WebSphere Commerce PMI module performance monitoring
Steps to enable WCS Performance module
Step 1
Enable WCS Performance module.
Edit WCDE_ENT70\workspace\WC\xml\config\wc-server.xml and ensure enabled="true" for following entry
<component compClassName="com.ibm.commerce.performance.monitor.PerfMonitor" enable="true" name="PerfMonitor"/>
Step 2
Restart server
Open WAS console :
Select Server1 Under this check -
1.Select the Enable Performance Monitoring Infrastructure (PMI) check box.
2.Save and apply the change.

Now under monitoring and tuning - under performance viewer --> In current activity --> Select server1 and click on start monitoring.
By default Performance module for commerce is disabled, as shown in the screenshot below.
Follow this step to enable the module, select options as shown by the markers in the screen shot below.
After selecting the custom option, now make selections as indicated by markers on the screenshot.
Now run the Tivoli performance viewer and collect statistics real time.
After some time you should be able to see the performance stats being plotted real time on the graph.
Using same steps we can enable other stats aswell.
Refrence :WCS PMI Module, WebSphere Commerce PMI module performance monitoring
No comments:
Post a Comment